Code body Reconstruction
Experimental feature
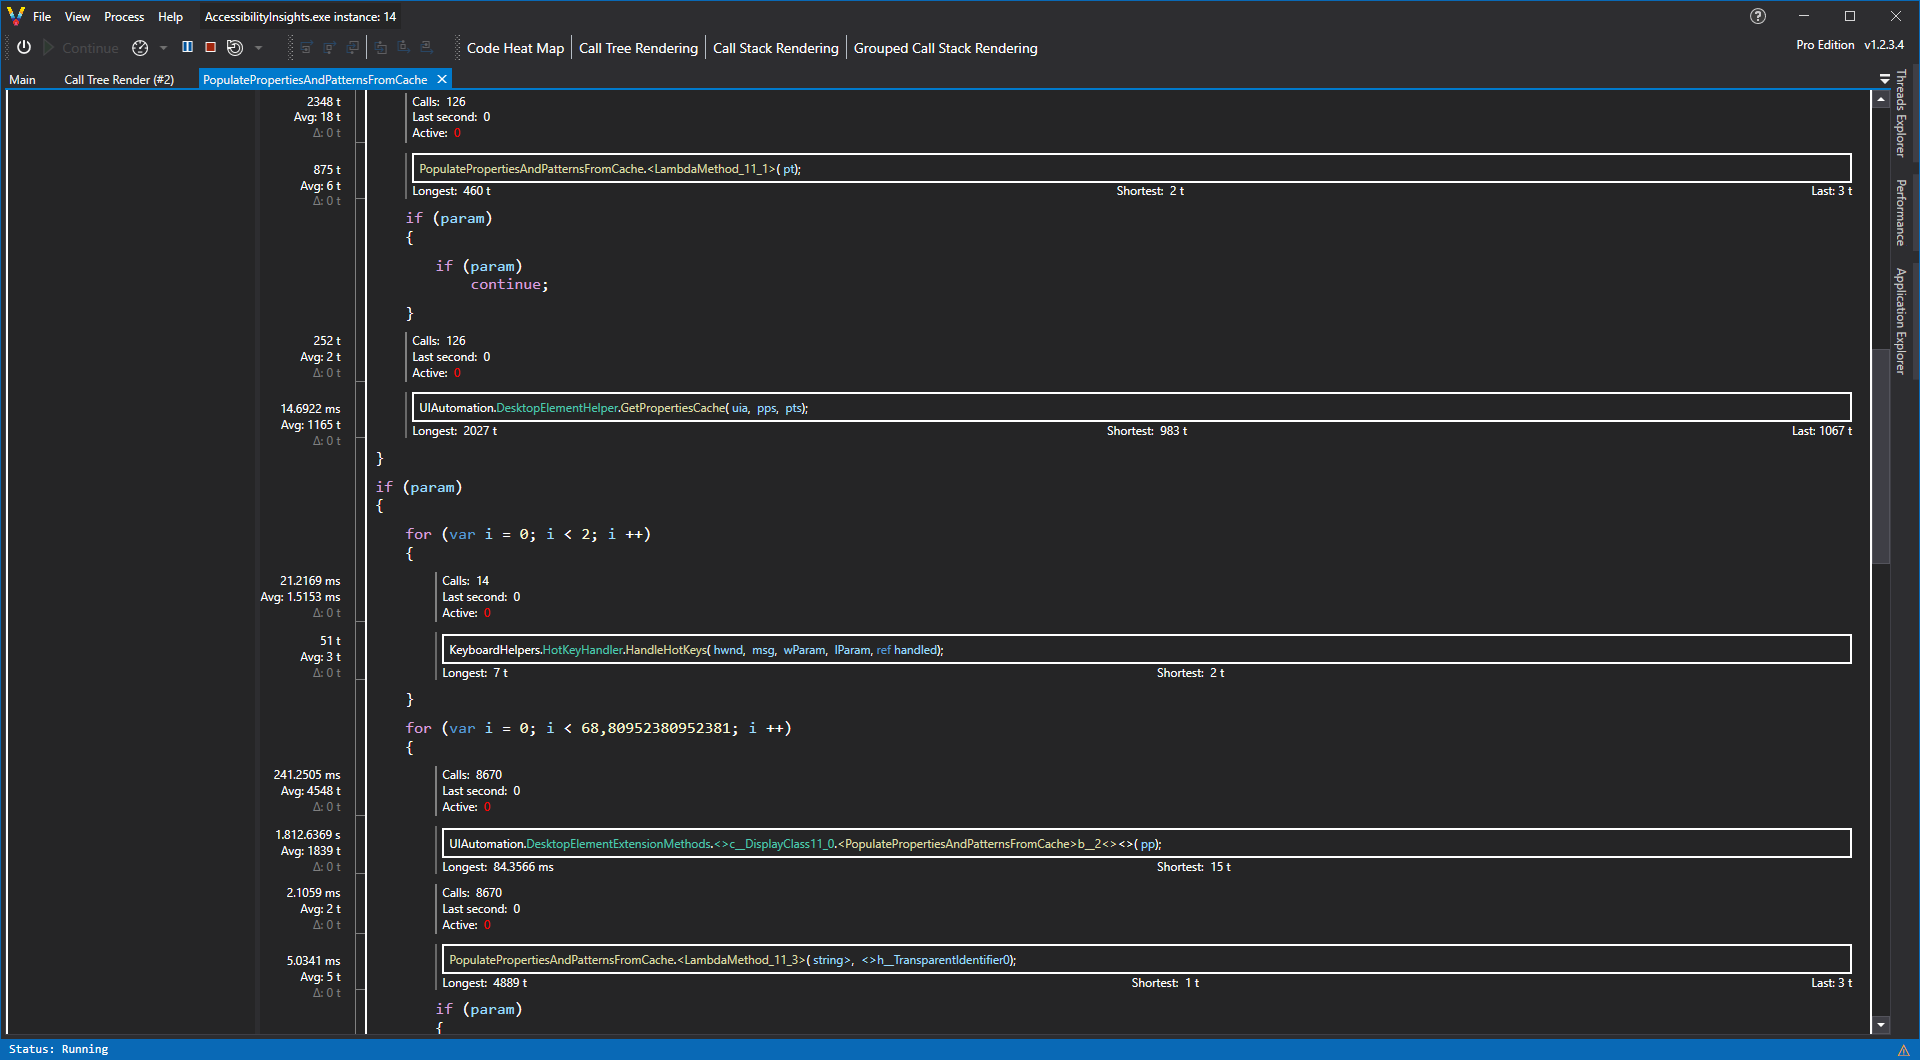
This feature is still very experimental, though it is available in all Editions, for more info see the Experimental warning below.Where other profilers stop and only show you how much time is spent in a code body, Code glass goes further and analyses the collected data and reconstructs the function body to is best of its ability, without using decompilation!
With this, it can show you not only how much time is spent in the function but much more, including:
- Show you where time is spent in the function
- How many times a loop is executed
- How many times a code path is called (Hot and cold paths)
- Where a current thread is in a function
- What time this function took when it was called from function “A” versus when it was called by Function “B”
- Where in the code a function call was made.
- What paths need to be taken inside the function to reach a specific function call
- How much time is spent in the function’s body between each function call.
- How many times a loop was executed
- How many times a path is taken
- Where a thread is in the function.
- Possibilities for optimizations, like loop unrolling.
- How your code behaves against what you wrote.
Because this is based on the collected data and not on decompilation, it shows you what your function is doing versus what you assumed it would do with your written code. It also causes that paths that are never taken will not be shown.
With this information, you can make discoveries, like a loop that runs far more than you expected, or a code path is called far more often than you assumed.
It also eliminates a massive need to add stopwatches through your code, as it can give you the same information, even in environments where you can not add them to the source code.
Experimental warning
This feature is still very experimental but is available in all editions; We did not want to make it a paid-only feature. Still, it would be a shame to currently only release it to the experimental Edition as it is already so helpful.
We encourage you to make a (bug) report for everything you find in Code Glass, but you do not have to report when the render fails, and you get an appropriate message about it. As we are aware that this feature does not play nice all the time, but like stated above, it would be a shame to only put this feature in the experimental Edition as it is already so helpful in the current state
This feature should never cause Code Glass to Crash; it is not that experimental ;)
Limitations
Because it is assumptions based on data, it can never be perfect. Collecting every possible path would take a massive amount of RAM (even downloading more is not enough), so we settled on doing it within the confinement of limited ram. That does not mean that it will not improve in the future; currently, it is far from perfect and can still be improved on a lot which we are also planning to do.
Known issues
- In some cases where reconstruction should be possible, it still fails.
- Currently, it does not show where an exception happens or is thrown in the code body. In the future, we will add this.
Views using this feature
See Also:
Feedback
Was this page helpful?
Glad to hear it! Please tell us how we can improve.
Sorry to hear that. Please tell us how we can improve.