Function Details View
Only functions use this view
This view is used only by functions, others use the Object Details ViewThis view has two inner views, Code Body View and the statistics view.
See them for more information.
Code Body View
Experimental feature
This feature is still very experimental, though it is available in all Editions, for more info see the the Code Body Reconstruction feature description.This is not done by decompiling your application!
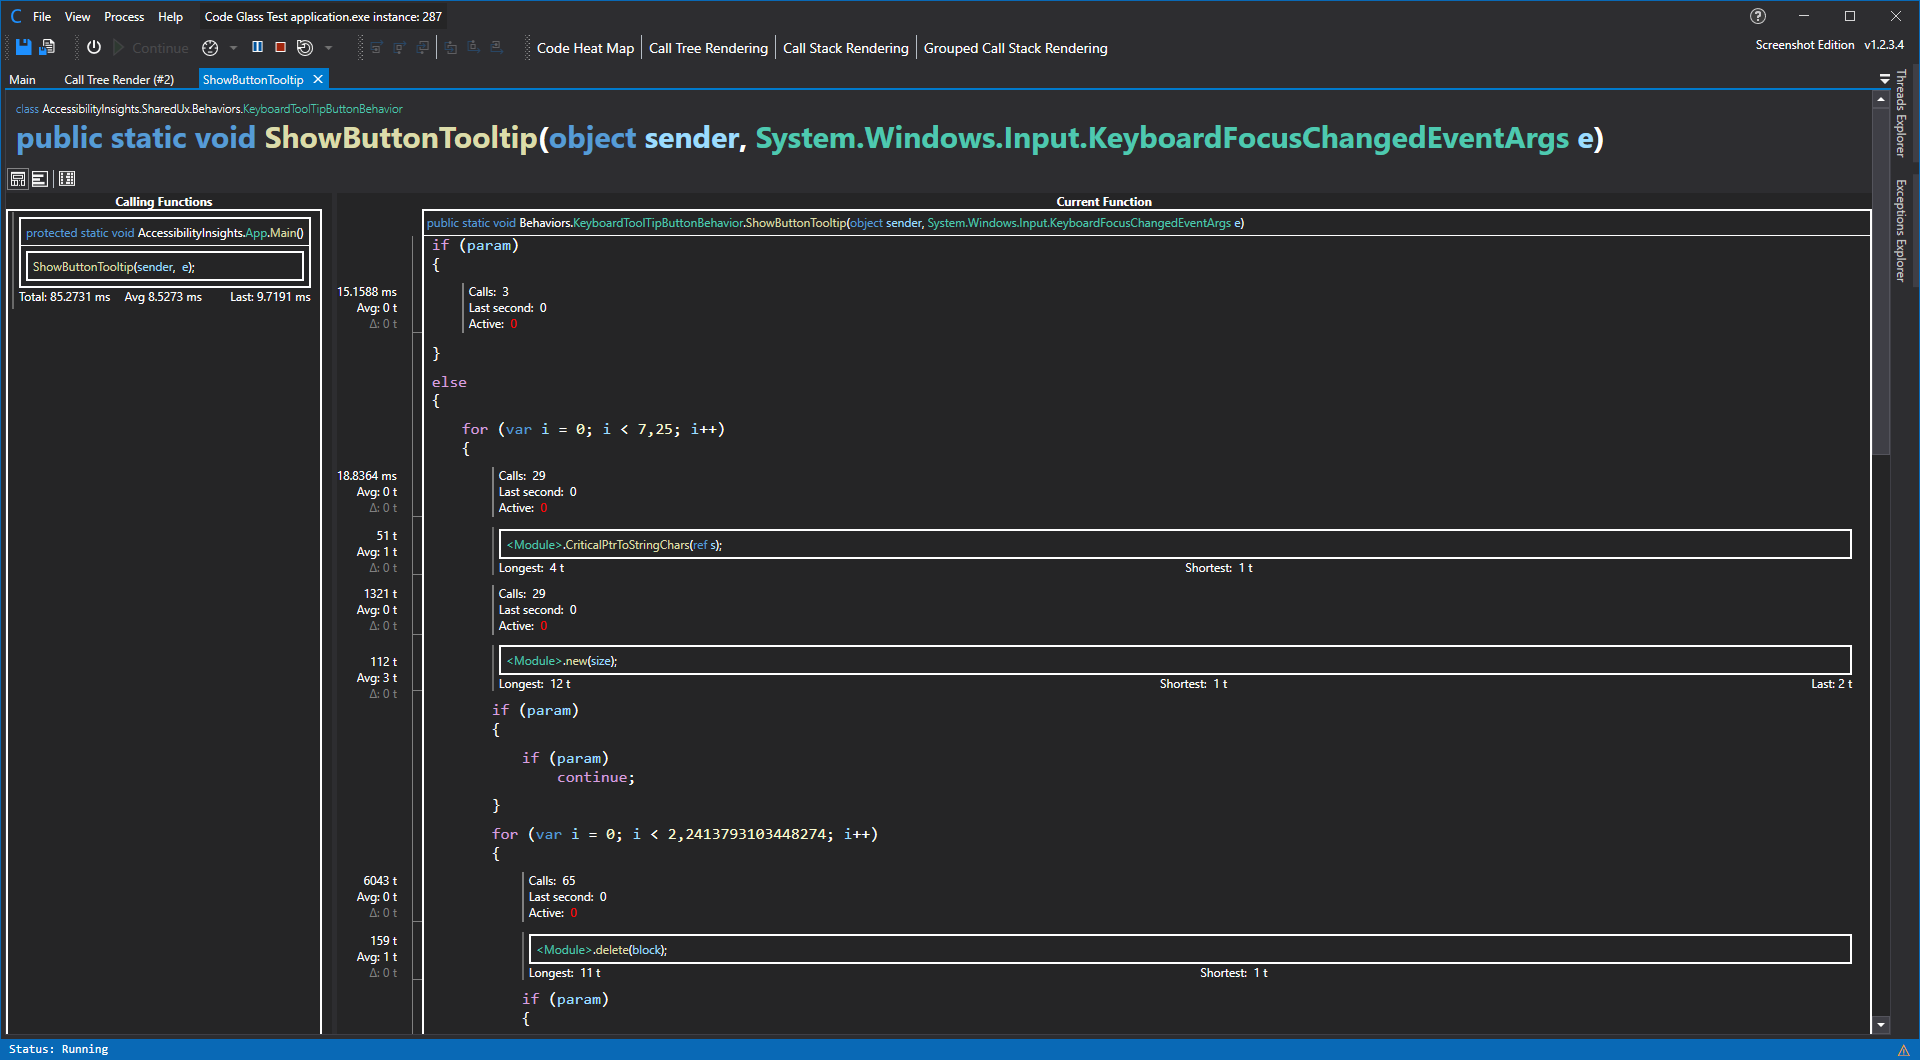
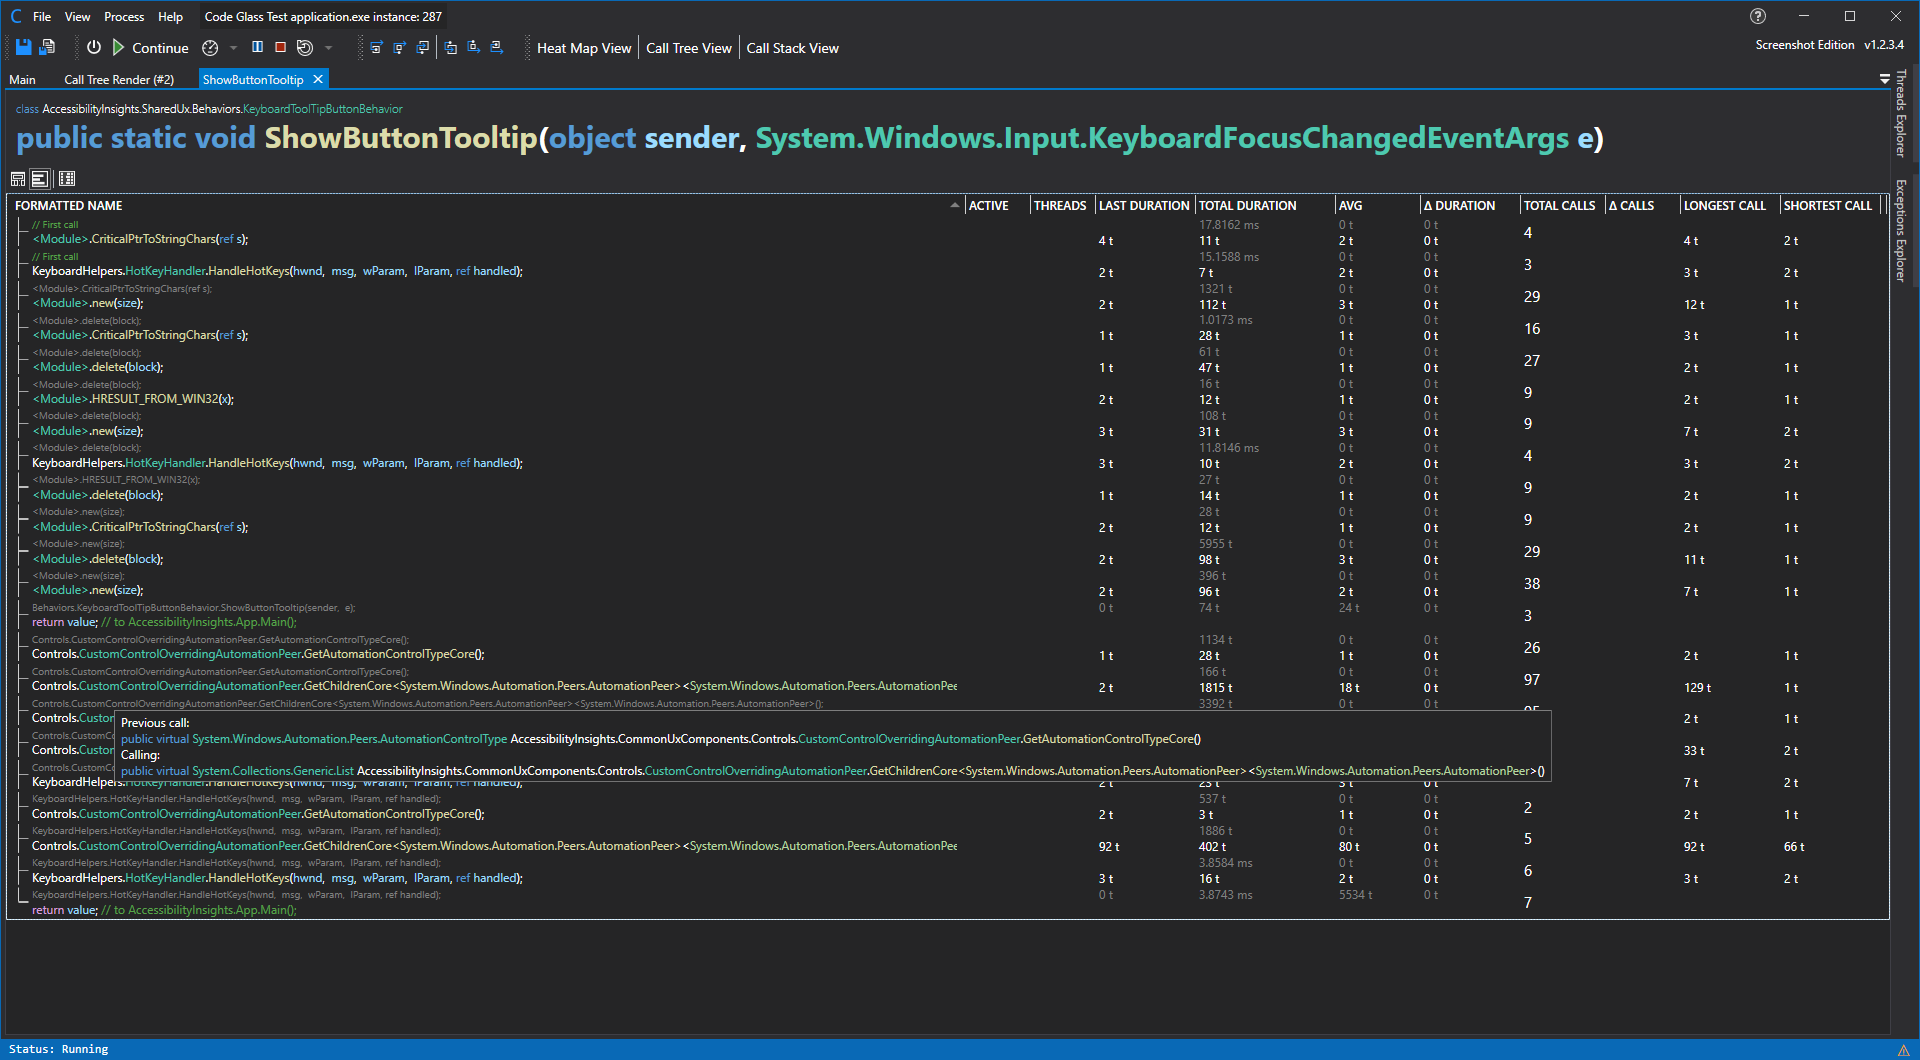
This feature does not work by decompiling your application and inspecting your code, for info on how it does work see the the Code Body Reconstruction feature description.From this view you can see on the left what functions call this function and how much time the function took for the caller.
On the Right you see the embodiement of our Code Body Reconstruction feature.
This view shows you not only wich functions were called in real time by this function but so much more, inluding:
- Where in the code a function call was made.
- What paths needs to be taken inside the function to reach a specific function call
- How much time is spend in the body of the function between each function call. (This iliminates a huge part of the need to add stopwatches to your code)
- How many times a loop was executed
- How many times a path is taken
- Where a thread is in the function.
- Hot Paths
- Cold Paths
- Possibilities for optimizations, like loop unroling.
- How your code really behaves against what you wrote.
- see Code Body Reconstruction feature for more.
Please keep in mind that this is an experimental feature available to anyone, for more information and help with any issues you might come across, check out Code Body Reconstruction feature.
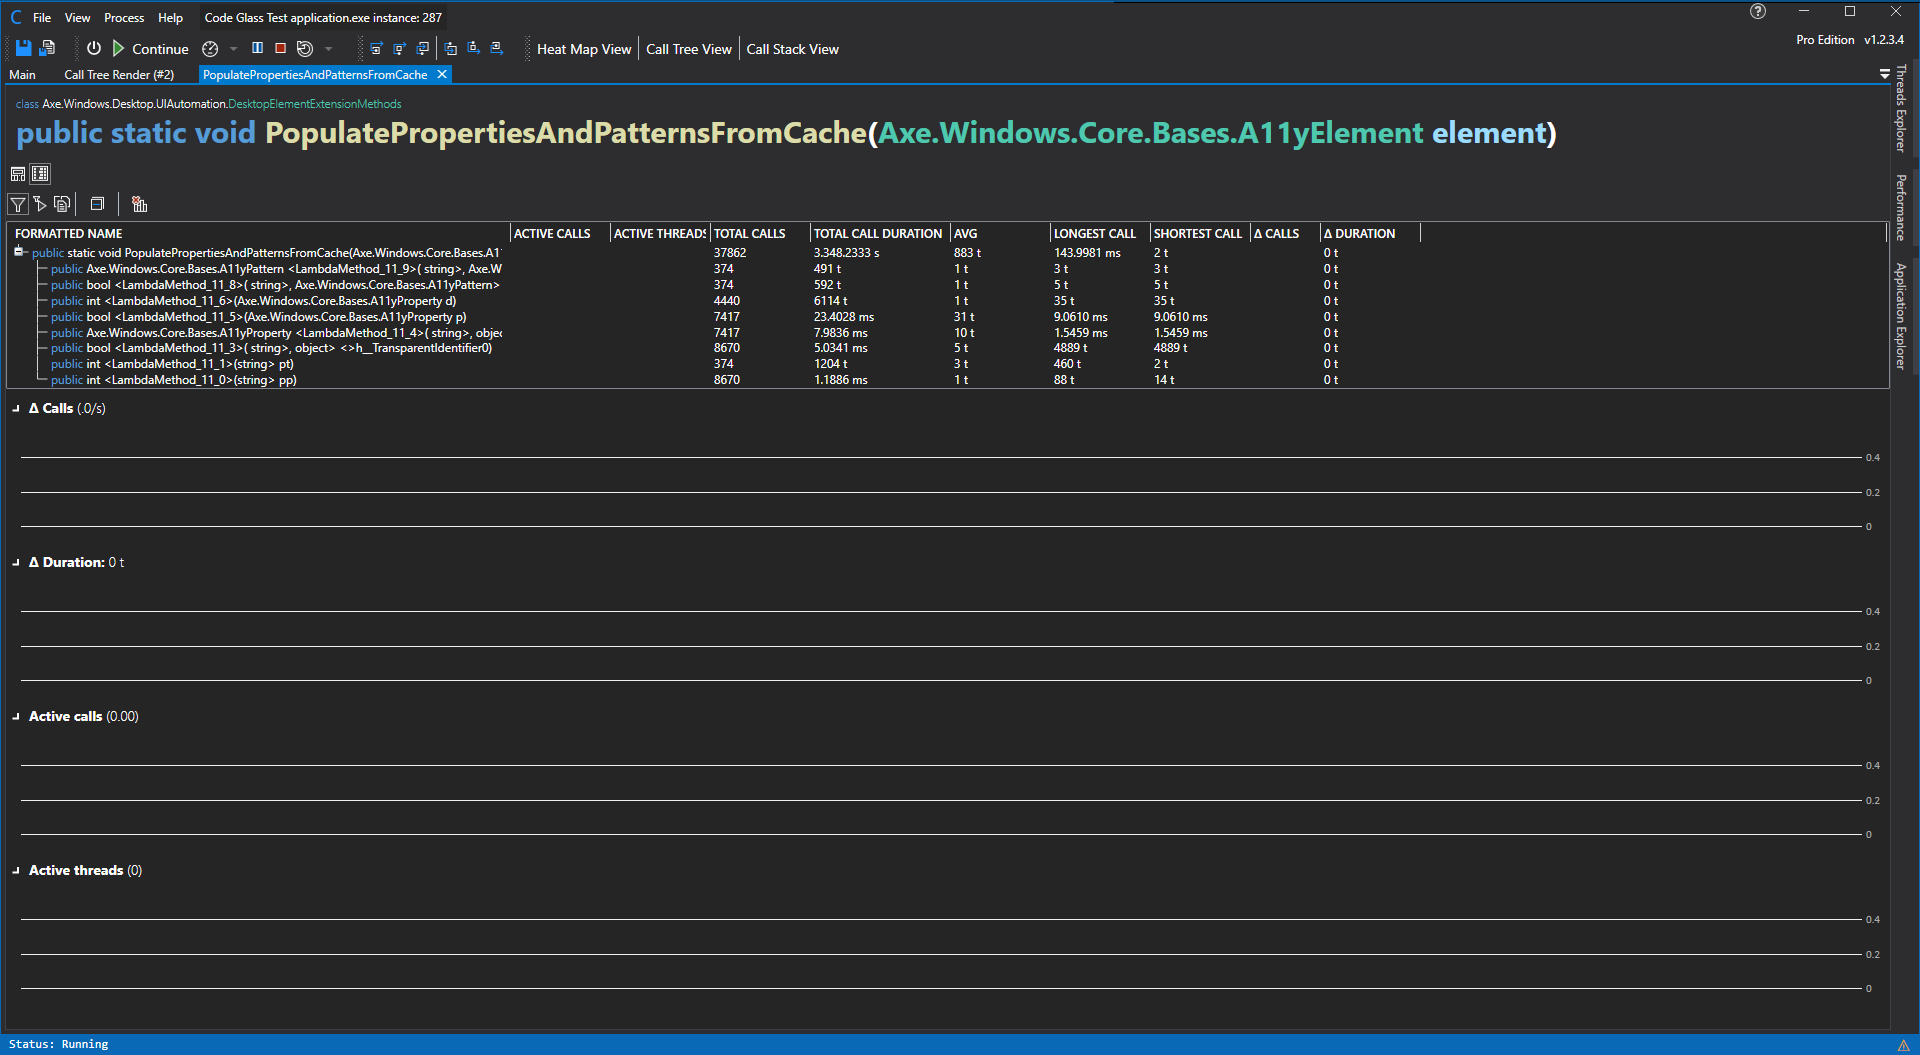
Code Body Statistics View
This view gives you statistics on the code paths within the function, it shows you the same information what the CodeBodyView shows but in a flat table that you can sort.
Currently we have the following data sets in order they appear in the screenshot:
- Active Calls, The amount of active calls under one item
- Active Threads, The amount of active threads unde one item
- Total Calls, The amount of total calls made while profiling under one item.
- Total Call Duration, the total amount of messured time spend under one item
- AVG, the average amount of messured time spend under one item
- Longest Call, the longest messured time spend under one item
- Shortest Call, the shortest messured time spend under one item
- Δ Calls, Amount of calls Last second under one item
- Δ Duration, the amount of messured time spend last second under one item
When you double click an item in the tree view it will open the Object Details View or Function Details View of the selected item.
Time messurement
To get more information on how we messure time, see Feature - Time Messurement
Statistics View
This view looks and works allot like the Statistics View, the only exception is that it only shows the data from this object instead of the whole profiled application instance by namespace, classes, methods, etc.
This view contains the general statistics of the profiled application by namespace, classes, methods, etc. The statistics are updated in real-time while the application is running.
In the toolbar, you have multiple options; the first 3 define what data you want to see. The options are:
- Current application instance filters
- Application Instance Start Filters
- Show all, CodeGlass will apply no filter.
Nest to that, you also have to option to collapse all items in the tree view.
The last one is to reset the current Shortest and Longest call; this will be expanded on in the future to reset more statistics. (Roadmap)
Currently we have the following data sets in order they appear in the screenshot:
- Active Calls, The amount of active calls under one item
- Active Threads, The amount of active threads unde one item
- Total Calls, The amount of total calls made while profiling under one item.
- Total Call Duration, the total amount of messured time spend under one item
- AVG, the average amount of messured time spend under one item
- Longest Call, the longest messured time spend under one item
- Shortest Call, the shortest messured time spend under one item
- Δ Calls, Amount of calls Last second under one item
- Δ Duration, the amount of messured time spend last second under one item
When you double click an item in the tree view it will open the Object Details View or Function Details View of the selected item.
Time messurement
To get more information on how we messure time, see Feature - Time Messurement
Application Breadcrumbs
- {All paths leading to} / Application Instance Window /
Feedback
Was this page helpful?
Glad to hear it! Please tell us how we can improve.
Sorry to hear that. Please tell us how we can improve.