Exception Details View
Toolbar

- Opens the Info Tab
- Opens the Call Tree View
- Opens the Call Stack View
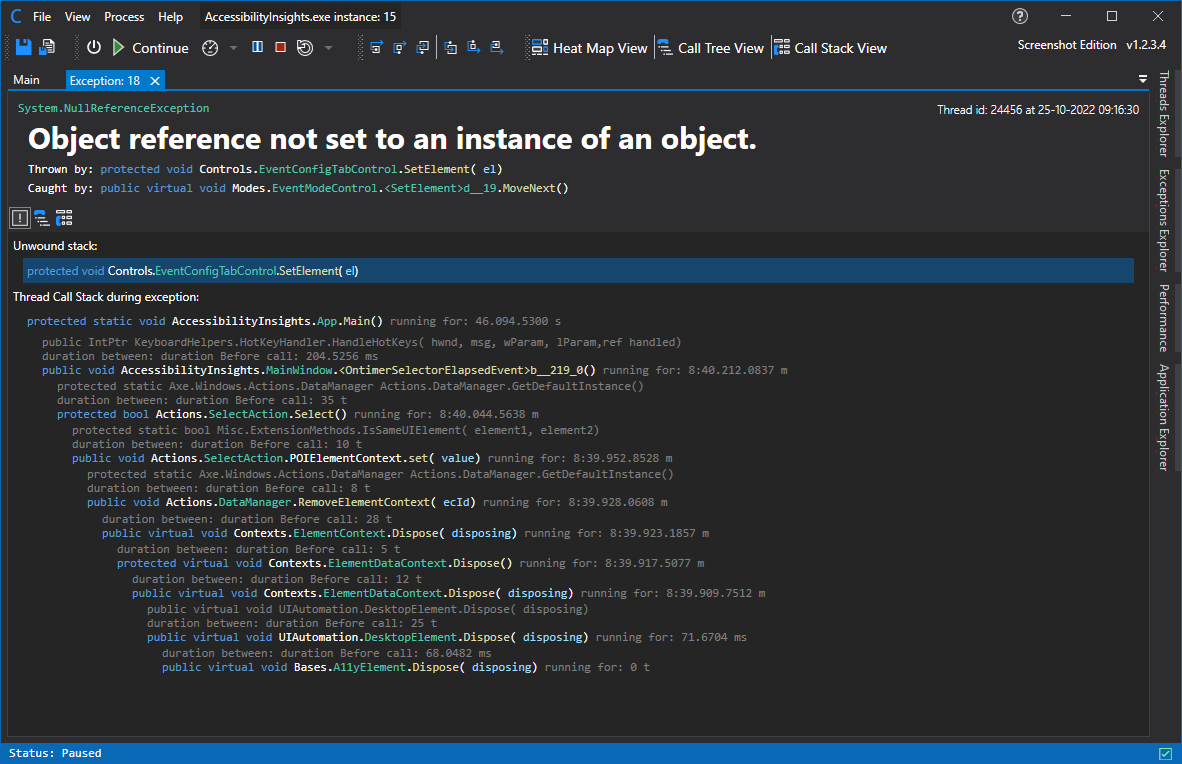
Exception Info View
This view shows you data from the thrown exception, this includes:
- The Exception Type
- When the exception occurred.
- What function threw the exception.
- What function caught the exception.
- The call stack that got unwound when the exception happened.
- The collected call stack of the remaining stack after it was caught .
This feature will be expanded upon with finer control and more information in the future. (Roadmap)
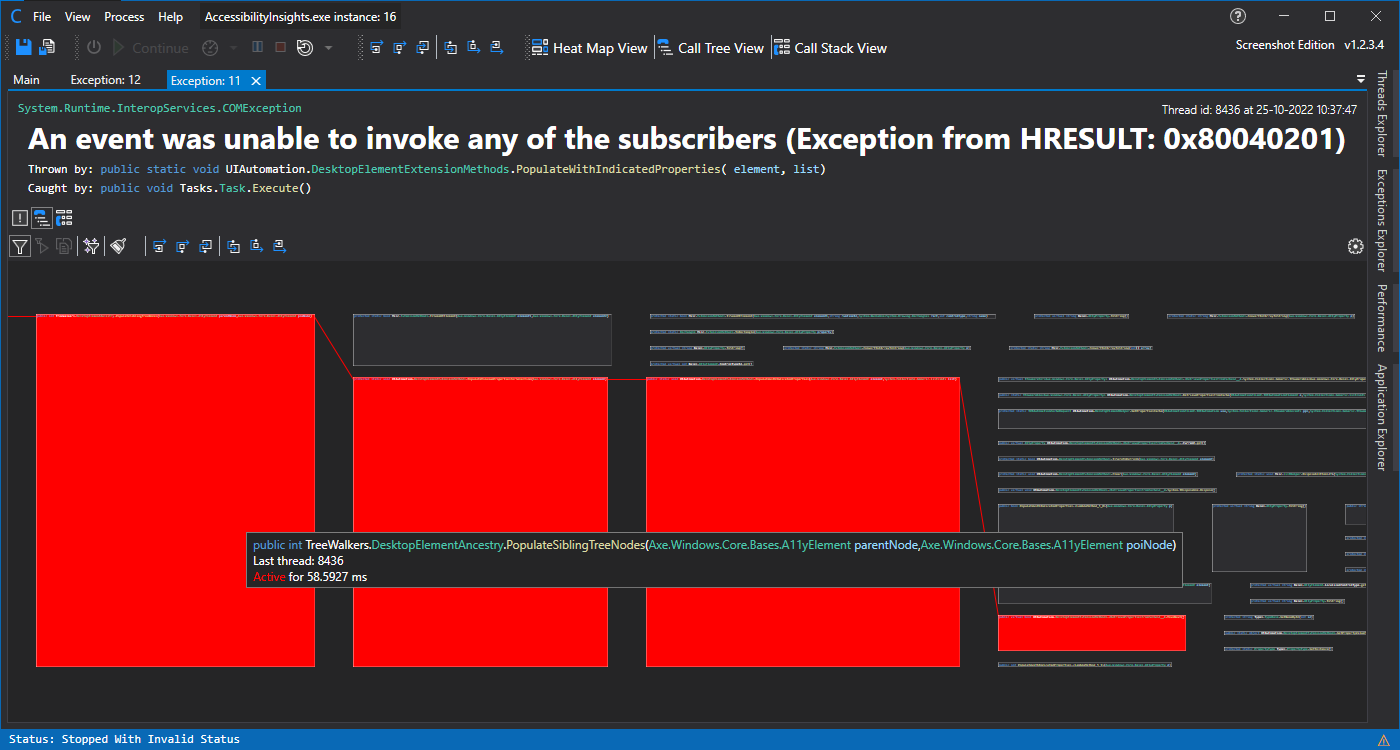
Exception Call Tree View
Photosensitivity warning
Because of the nature of the realtime rendering and thread colors it might have a strobing effect that may affect photosensitive users.No one of us is photosensitive so we cant test it and we did not have any reports from users however we wanted to warn you anyway because we imagine that it can.
Better safe than sorry right?
See Feature - Realtime call tree Rendering for more information about the feature.
Hovering over an item will show you information about the Last or current thread using that function.
Hovering over a line will show you where it comes from and where it goes to.
Right click on an item will open the Context Menu.
Double clicking or with the conext menu of an item will open the Function Detail View of that item. However, the details will reflect the current state of the application, not when the exception happened. (Roadmap)
Call Tree Toolbar

With the toolbar you can do the following:
- Select what filter tyoe you want to use for filtering
- Current Filters
- Start Filters, see Roadmap - Rendering Filter Types
- No Filter, see Roadmap - Rendering Filter Types
- Filter the current rendered items
- Clear the current render screen
- Reposition screen to default zoom and position
- Steps Back Out (Ctrl + Shift + F11) the current function back to before the current function was called
- Steps Back Over (Ctrl + F10) the previous function
- Steps Back Into (Ctrl + F11) the previous function
- Steps Into (F11) the next function
- Steps Over (F10) the next function
- Steps Out (Shift + F11) the current function
- Open the Settings window
- Open the Settings window
Call Tree Settings Window
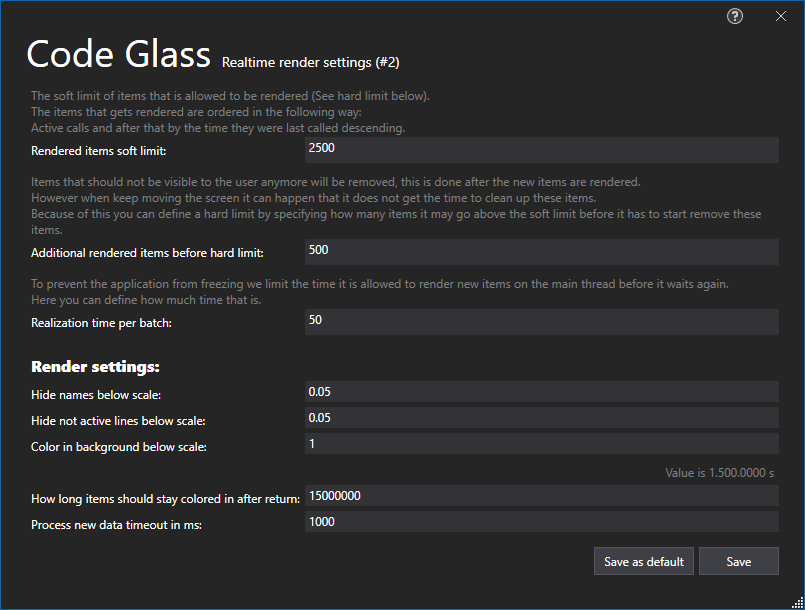
Most of the settings are quite self explainitory.
You can choose to save these settings as your new default for new renders or only for this render.
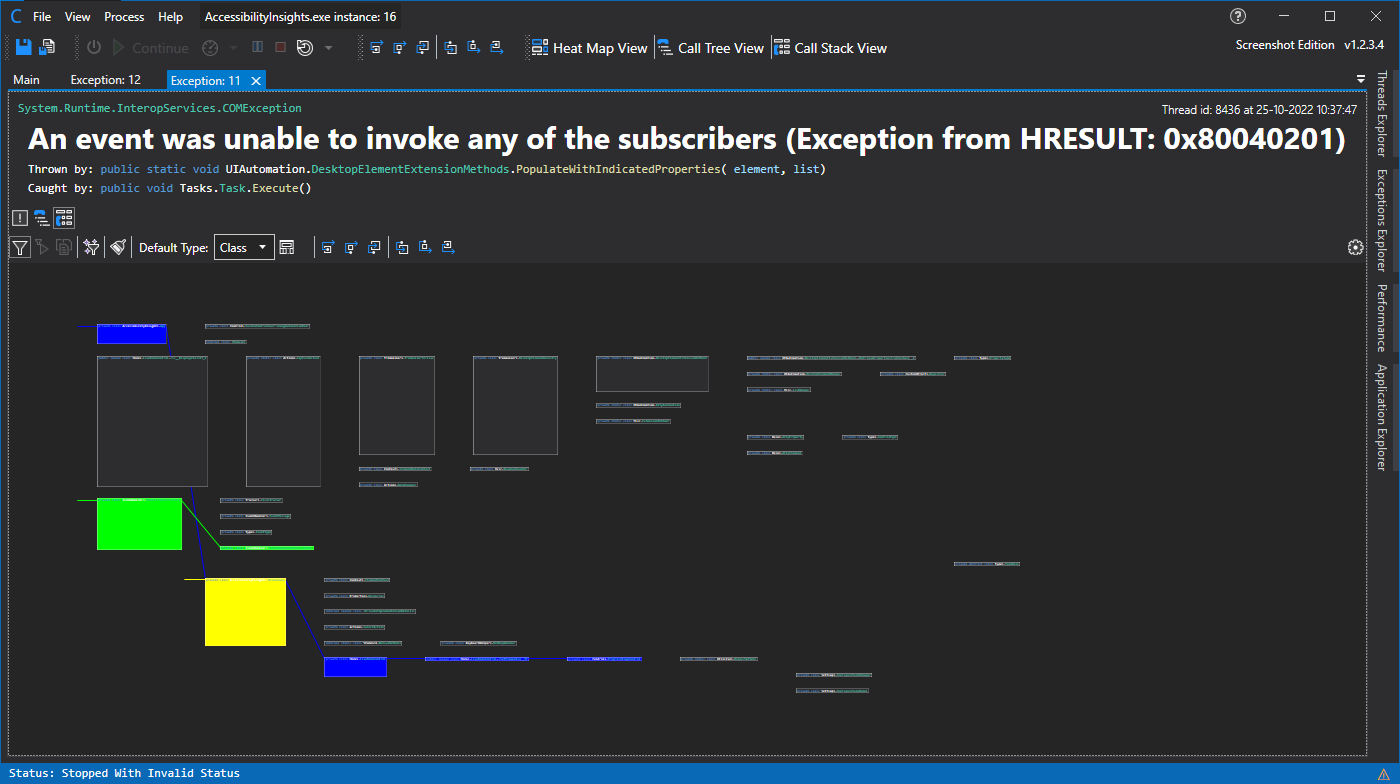
Exception Call Stack View
Call Stack Toolbar

With the toolbar you can do the following:
- Select what filter tyoe you want to use for filtering
- Current Filters
- Start Filters, see Roadmap - Rendering Filter Types
- No Filter, see Roadmap - Rendering Filter Types
- Filter the current rendered items
- Clear the current render screen
- Selecting the object type new rendered items will be grouped by.
- Forcing all rendered items to be grouped by the selected object type.
- Steps Back Out (Ctrl + Shift + F11) the current function back to before the current function was called
- Steps Back Over (Ctrl + F10) the previous function
- Steps Back Into (Ctrl + F11) the previous function
- Steps Into (F11) the next function
- Steps Over (F10) the next function
- Steps Out (Shift + F11) the current function
- Open the Settings window
- Open the Settings window
Call Stack Settings Window
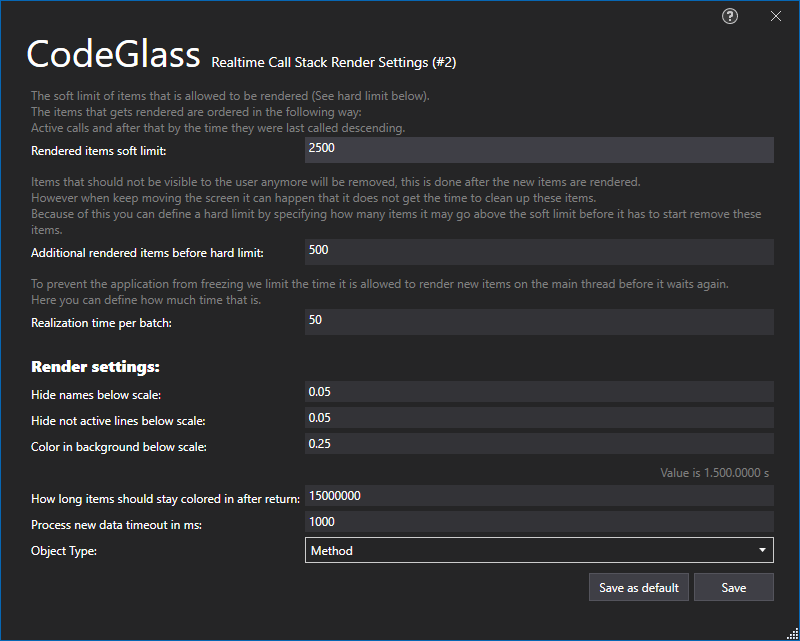
Most of the settings are quite self explainitory.
You can choose to save these settings as your new default for new renders or only for this render.
Item Context Menu
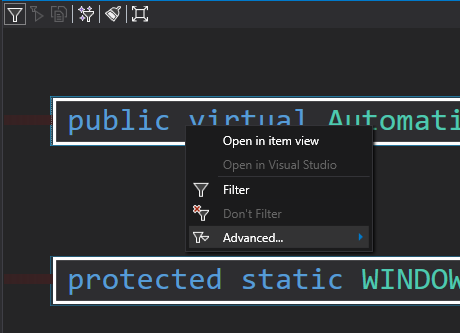
When you right click an item you have the following options:
- Open in item view, this opens the Function Detail or Object Detail view
- Open in Visual Studio, see Roadmap - Open Item In Visual Studio
You can filter the item by:
- Filter (Remove all allowed access modifiers)
- Don’t Filter (Allowing All Access Modifiers)
- Change its allowed access modifiers (Under Advanced)
Threads and Coloring
Every thread rendered is assigned the most diferent color available, this is why the first 3 threads are Reg, Green and Blue (RGB) Then it will start using the most different shades of RGB and so forward.
The Lines between the functions called by a thread applies this color, also you can specifiy in the settings wheter the background of a function also gets colored in by setting the scale on wich that should happen.
We change the transparency of the applied color when a function is not active anymore. You can see an example of this in the screenshots above, for example on the first screenshot on the function that has the tooltip open, the red color got much darker as the background is dark.
The background will be colored in with this color for a time after it is not active anymore specified in the settings, this is to make sure you see that a function has been called as we can profile allot of functions in a second.
Application Breadcrumbs
- { All paths leading to } / Thread Explorer /
Feedback
Was this page helpful?
Glad to hear it! Please tell us how we can improve.
Sorry to hear that. Please tell us how we can improve.