Object Details View
Functions do not use this view
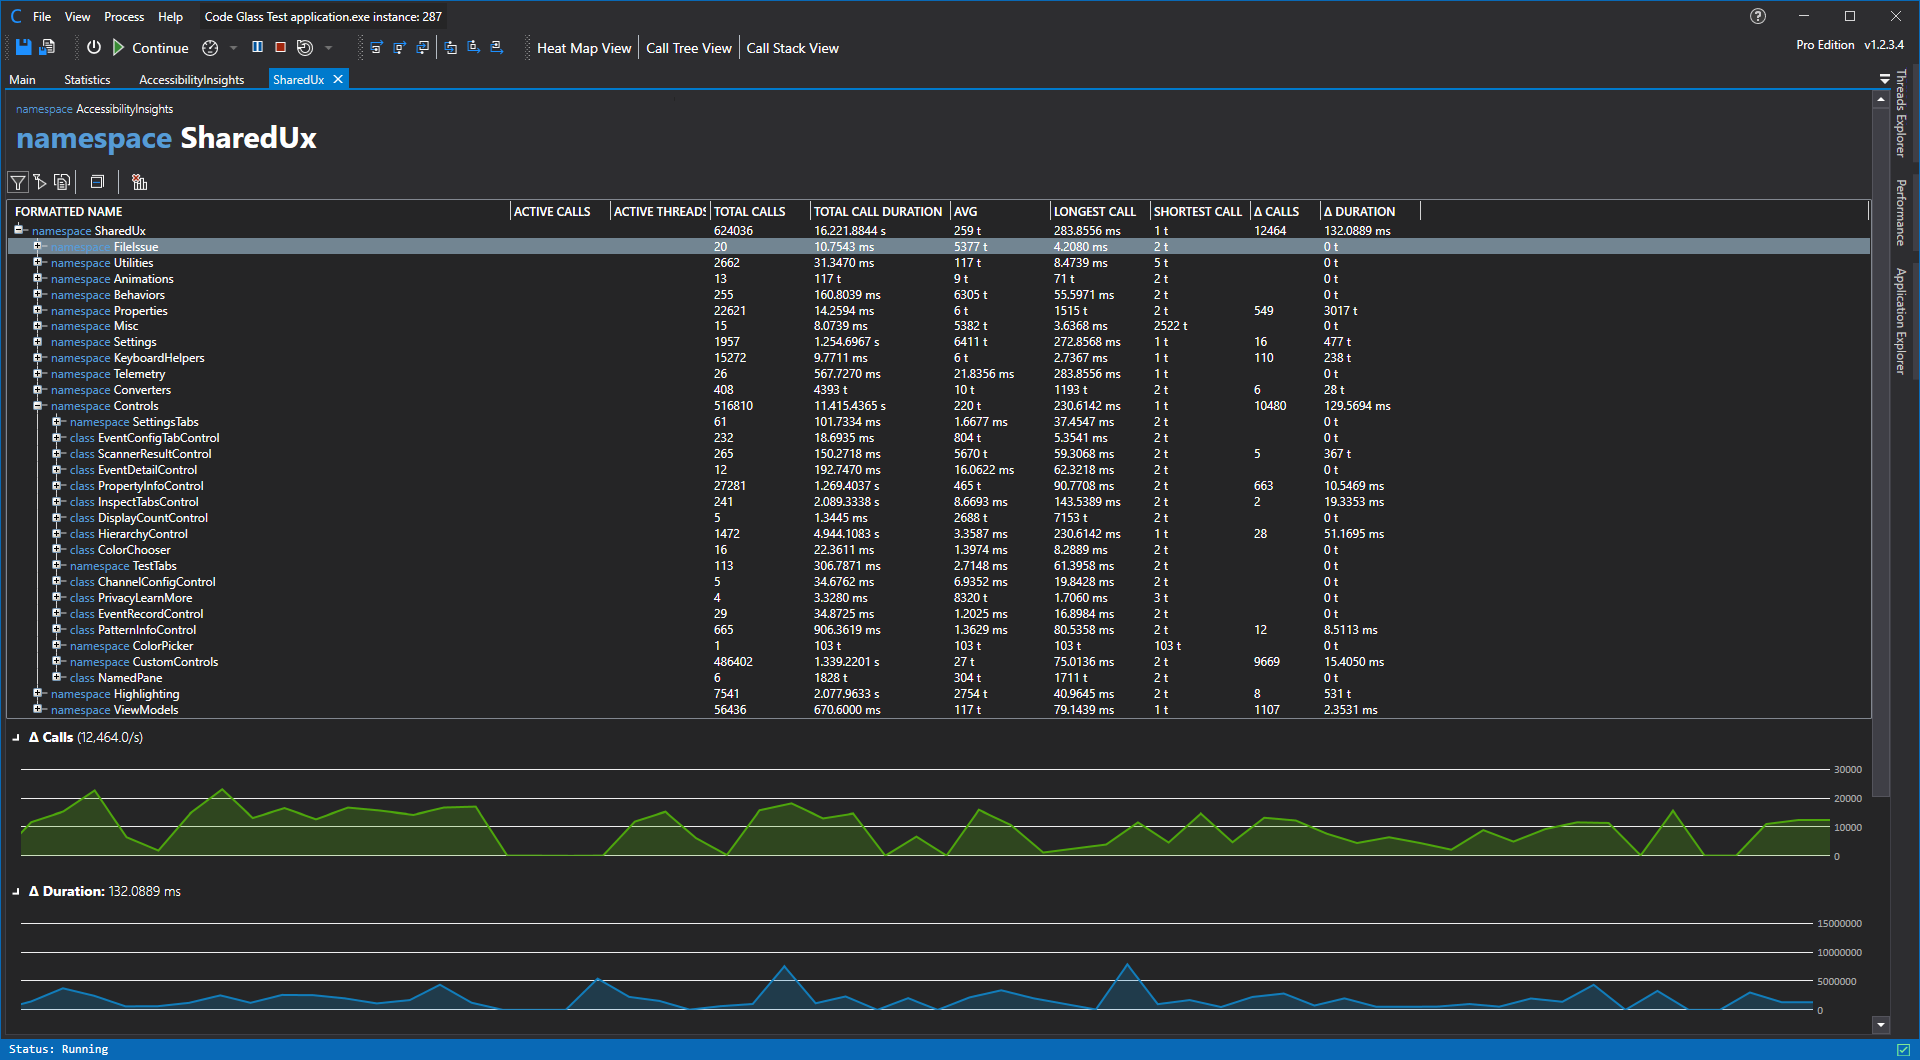
This view is used by all object types except code members, they use the Code Member Details ViewThis view looks and works allot like the Statistics View, the only exception is that it only shows the data from this object instead of the whole profiled application instance by namespace, classes, methods, etc.
This view contains the general statistics of the profiled application by namespace, classes, methods, etc. The statistics are updated in real-time while the application is running.
In the toolbar, you have multiple options; the first 3 define what data you want to see. The options are:
- Current application instance filters
- Application Instance Start Filters
- Show all, CodeGlass will apply no filter.
Nest to that, you also have to option to collapse all items in the tree view.
The last one is to reset the current Shortest and Longest call; this will be expanded on in the future to reset more statistics. (Roadmap)
Currently we have the following data sets in order they appear in the screenshot:
- Active Calls, The amount of active calls under one item
- Active Threads, The amount of active threads unde one item
- Total Calls, The amount of total calls made while profiling under one item.
- Total Call Duration, the total amount of messured time spend under one item
- AVG, the average amount of messured time spend under one item
- Longest Call, the longest messured time spend under one item
- Shortest Call, the shortest messured time spend under one item
- Δ Calls, Amount of calls Last second under one item
- Δ Duration, the amount of messured time spend last second under one item
When you double click an item in the tree view it will open the Object Details View or Function Details View of the selected item.
Time messurement
To get more information on how we messure time, see Feature - Time Messurement
Application Breadcrumbs
- {All paths leading to} / Application Instance Window /
See Also:
Feedback
Was this page helpful?
Glad to hear it! Please tell us how we can improve.
Sorry to hear that. Please tell us how we can improve.