Garbage Collection Invocations
This feature allows you to gain insights into what your application does during garbage collection. This can help you track down objects that do not get removed or find objects that get removed to fast.
Limited support
At this point the only languages to support this feature are Julia and .NET, but more will be added soon.Garbage Collection Invocations Explorer
The garbage collection invocations explorer shows you all the rounds of garbage collection that have occurred during the execution of your application. This allows you to quickly see if your application is running more or less rounds of garbage collection than you expected.
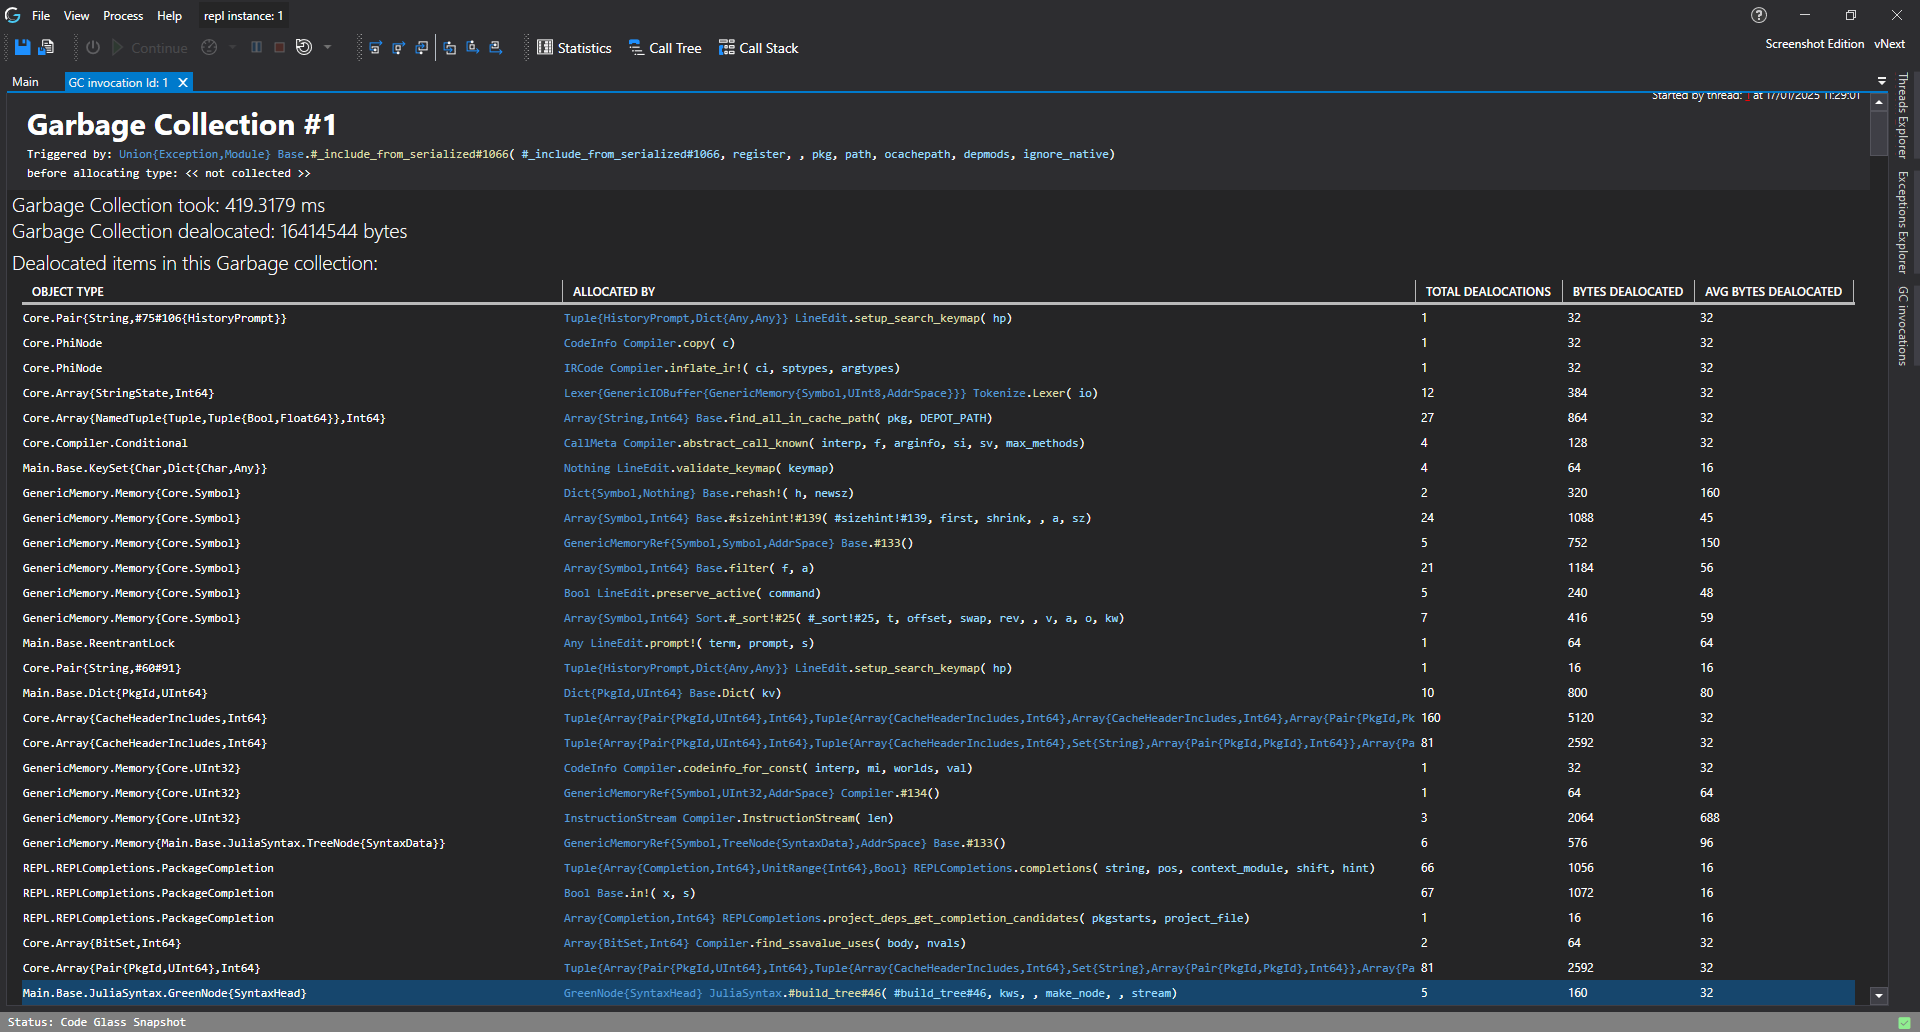
Garbage Collection Statistics
Besides seeing all the garbage collections that have happened, you can also view what happened during the garbage collection. The following pieces of information are available:
- The method that was being executed when the garbage collection was triggered.
- The type of the object that was being allocated when garbage collection was triggered.
- The amount of time the garbage collection took.
- The amount of bytes that were freed by the garbage collection.
- Every object that was deallocated, including the method that originally allocated that object.
Feedback
Was this page helpful?
Glad to hear it! Please tell us how we can improve.
Sorry to hear that. Please tell us how we can improve.