Heat Map
The Heat Map view helps you quickly spot hot spots in your application.
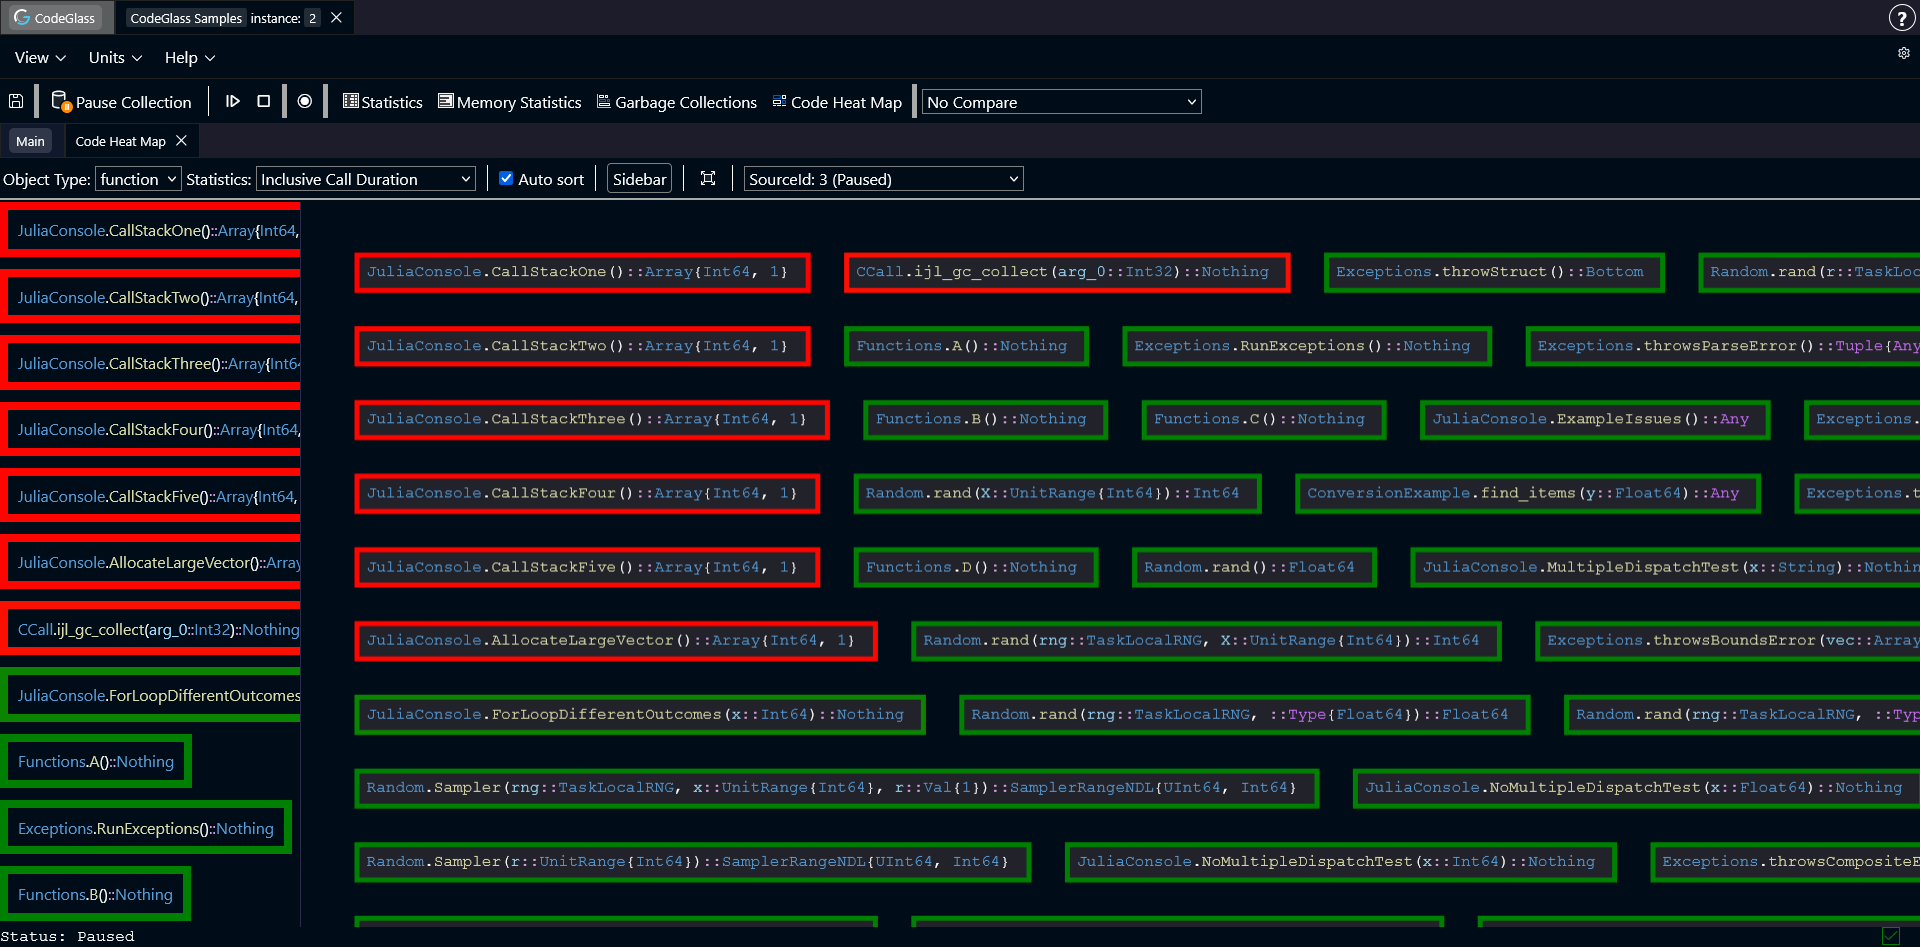
Instead of showing a large table, this view displays functions as colored blocks. The blocks are ordered and colored based on a selected statistic.
Functions that perform worse compared to others appear more red. Functions that perform better appear more green. This makes it easier to see which parts of the code may need attention.
Toolbar
Above the heat map there is a toolbar. These options control how the heat map displays data.
- Object Type: a dropdown that controls how the data is grouped. By default it groups by function, but you can also group by module.
- Statistic: select which statistic the heat map should use to color and order items.
- Auto sort: when enabled, the heat map automatically reorders items when you change the statistic, or when new functions get profiled.
- Sidebar: toggles the sidebar on or off.
- Recenter: moves the heat map back to the center. Useful if you zoomed or dragged the view too far.
- Data source selection: select which data source the heat map should use.
Sidebar
The sidebar shows the same data as the heat map, but in a list. Keep in mind that it only shows the items that are currently visible in the render view port.
Controls
You can move around the heat map by clicking and dragging with the mouse. Double clicking on any of the functions opens the Code Member screen of this function.
Use Ctrl + Scroll to zoom in and out.