Performance
The Performance view shows how runtime events are distributed over time.
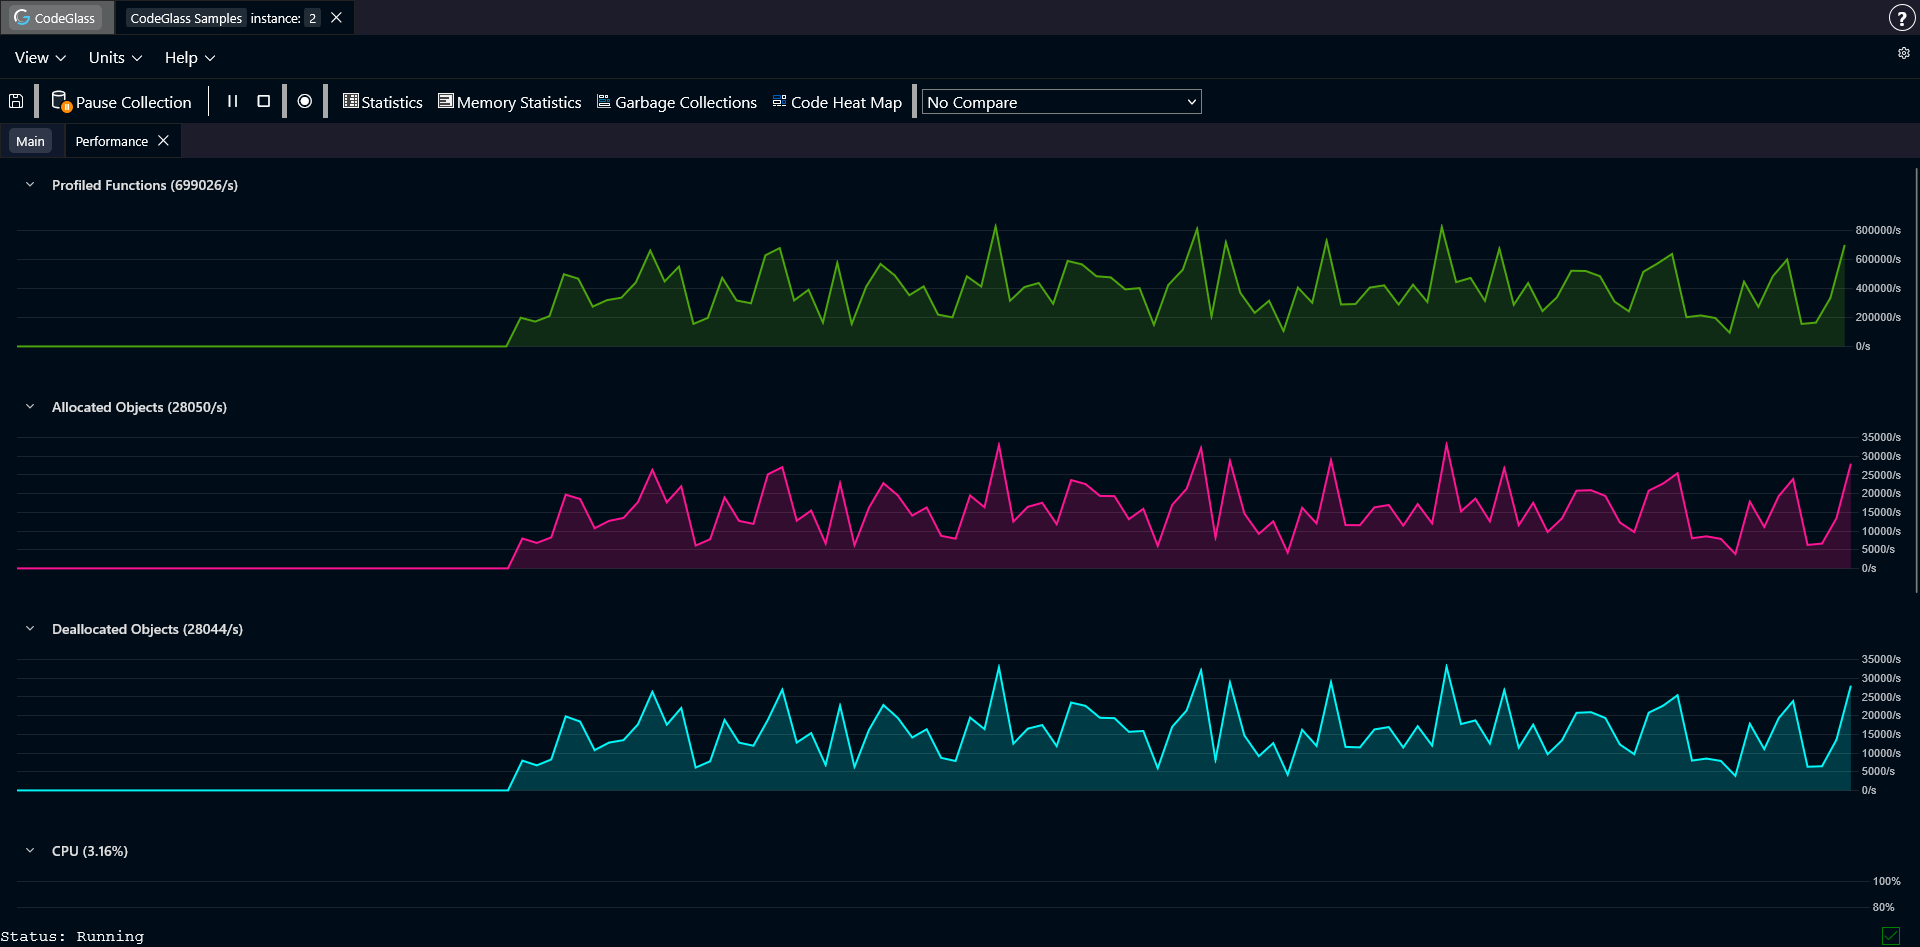
Each chart represents a different type of event that CodeGlass tracks while your application is running.
This view can help you spot sudden changes in behavior. For example, you might see a spike in allocated objects, a large number of deallocations, or a sudden increase in function calls.
The view includes charts for:
- Functions profiled: number of functions that were executed.
- Allocated objects: number of objects allocated over time.
- Deallocated objects: number of objects freed over time.
- CPU usage: CPU usage of the process.
- Memory used by the process: total memory used by the running process.
- Amount of active tasks: number of tasks that were active.