Statistics
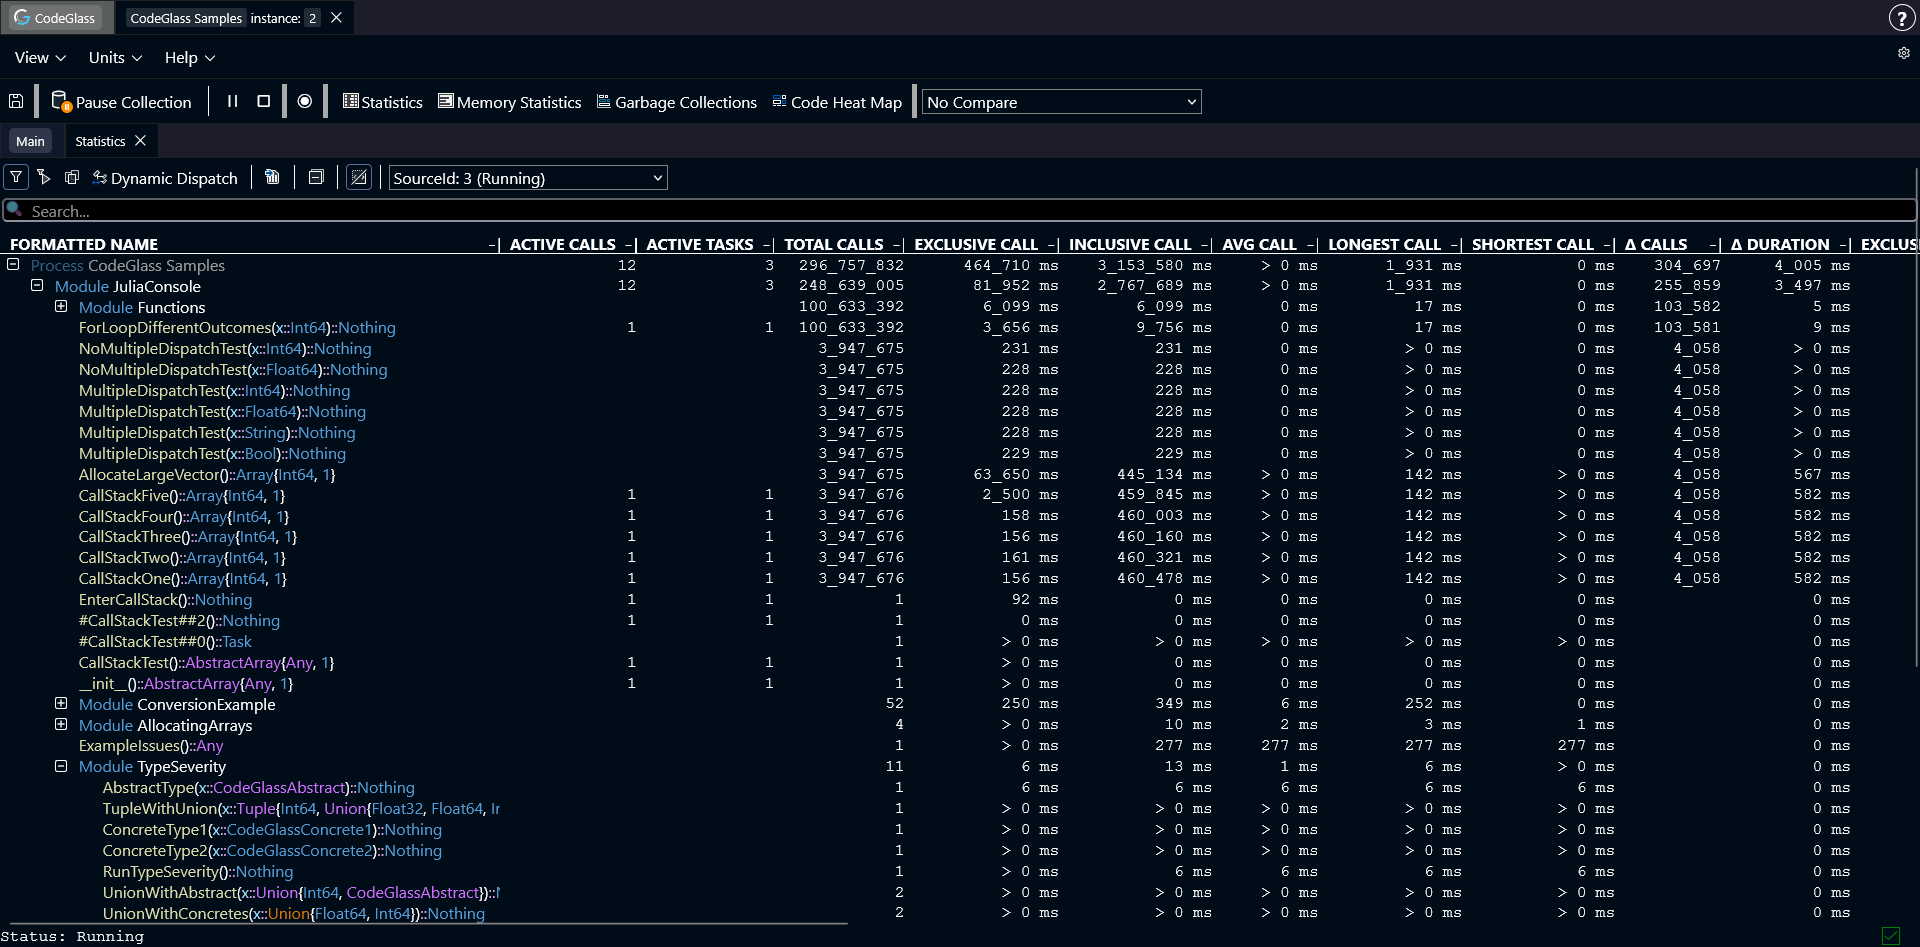
The Statistics view shows general statistics for all functions that were called during the run of your application.
Functions are grouped by the module where they are defined.
Double-clicking a module opens a new view that only shows the functions from that module.
Double-clicking a function opens the Code Member view for that function.
You can also click on any column in the table to sort the data by that statistic.
Toolbar
Above the table there is a toolbar with several options:
- Filtering: filters the data shown in the table. More about filters here.
- Export to CSV: generates a CSV file from the table. The file is automatically downloaded to your device.
- Collapse All: collapses all modules in the table.
- Data Source: select which data source the statistics should use.
Search
The searchbar can be used to search for code members.
Double-Clicking a search result will try to show the code member in the table.
Ctrl+Click on a search result will open the Code Member view of that code member.
At present, searches are limited to code member names and do not include modules or types. Applied filters are also not taken into account.
Types of Statistics
The statistics table contains several columns with statistics about the functions and modules within the application. Below, each type of statistic is explained for a function. The statistics for a module or process are the sum of the statistics of all functions within that module or process.
- Active Calls: The number of active calls at this very moment.
- Active Tasks: The number of active tasks at this very moment.
- Total Calls: The total number of calls that happened in the selected data source.
- Exclusive Call: The call duration of this function, excluding the time of the functions that get called inside of this function.
- Inclusive Call: The call duration of this function, including the time of the functions that get called inside of this function.
- Average Call: The average call duration of this function.
- Longest Call: The longest time a function took to execute.
- Shortest Call: The shortest time a function took to execute.
- Δ Calls: The amount of calls in the last second.
- Δ Duration: The sum of all call duration in the last second.
- Exclusive Allocations: The amount of allocations inside of this function, excluding the allocations of the functions that get called inside of this function.
- Exclusive Deallocations: The amount of deallocations inside of this function, excluding the allocations of the functions that get called inside of this function.
- Δ Allocations: The difference in exclusive allocated and deallocated objects.
- Exclusive Allocated Bytes: The amount of allocated bytes inside of this function, excluding the allocated bytes of the functions that get called inside of this function.
- Exclusive Deallocated Bytes: The amount of deallocated bytes inside of this function, excluding the allocated bytes of the functions that get called inside of this function.
- Δ Allocated Bytes: The difference in exclusive allocated and deallocated bytes.
- Inclusive Allocations: The amount of allocations inside of this function, and all other functions inside.
- Inclusive Allocated Bytes: The amount of allocated bytes inside of this function, and all other functions inside.
If memory profiling is turned off, the columns with memory statistics will not be shown.