Profiling Settings
The settings defined here are used as template for new applications, each setting is detailed below.
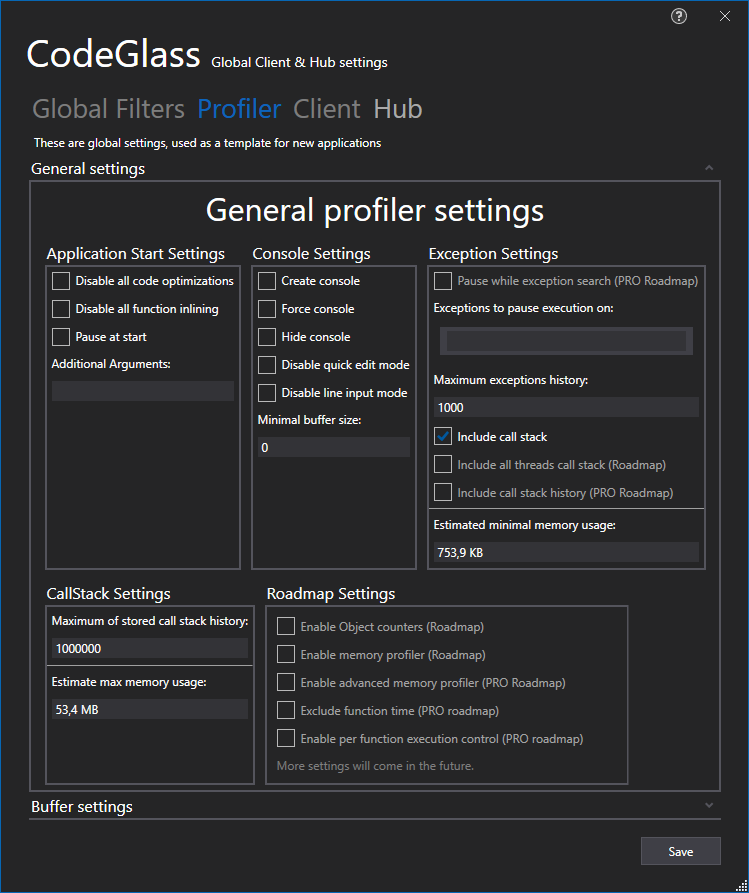
General settings
Application Start Settings
Settings used at the start of the application instance can not be changed after the application instance has started.
- Disable all code optimizations
- Disable all function inlining
- Pause at the start, Pauses the application before it ran any not filtered code.
- Additional Arguments, the set of command-line arguments to use when starting the application
Keep in mind that currently, with Visual Studio Solution Runtime, additional Arguments are supplied to the Visual Studio Process (devenv.exe) process, not to the process you are debugging with Visual Studio. If you require CodeGlass to supply it to the debugging process let us know by filing an issue on github.
Console Settings
These are the console settings that you can attach to the application if it does not have one.
- Create a console, attach a console to the application if it does not have one.
- Force Console attaches a new console to the application, even if it has one.
- Hide Console, Hides the (newly attached) console of the application.
- Disable quick edit mode, Disables text selection on the console of the application (As this causes the application to freeze)
- Disable Line input mode, Disables being able to type/give input in the application console.
- Minimal buffer size, sets the buffer size of the console
Exception Settings
- Pause while exception search, pauses the application while the catcher of an exception is searched (Roadmap), useful for exceptions that are caused by racing conditions.
- Exceptions to pause execution on, a list to specify which exceptions CodeGlass should automatically pause execution. (Press Enter or delete inside the text block to add or remove items.)
- Maximum exception history, the number of exceptions it stores before deleting the oldest one.
- Include call stack, If it should include the collected callstack with the exception.
- Include all threads call stack; if it should include the collected callstack of all threads, useful for exceptions that are caused by racing conditions.
- Include call stack history; if it should include the collected callstack history, with this, you can see what led to the exception.
The estimate of minimal memory usage shows how much memory the current exception settings can cost; for example, including call stack history can cost a large amount of memory.
CallStack Settings
How many call stack items are stored before removing the oldest one; this impacts how much stepping backwards you can do. It shows an estimate of how much memory it costs to store it.
Roadmap settings
Currently not changeable but will in the future release:
- Enable Object counters, counting of objects and instances. (Roadmap)
- Enable memory profiler, basic memory profiler. (Roadmap)
- Enable Advanced Memory profiler (Pro Edition), advanced memory profiling functions. (Roadmap)
- Exclude function time (Pro Edition), able to exclude function time each function call. (Currently included and will stay included by default for all editions) (Roadmap)
- Enable per function execution control (Pro Edition), allowes execution control but on function niveau. (Roadmap)
Buffer Settings
This is a highly advanced feature currently only available to the Experimental Edition. It is a way of controlling how big our buffers are between the application and Code Glass hub, but you need to set the values with a lot of care not to get unexpected results.
For example:
Setting the correct amount will result in the better (Faster) performance of the profiled application.
However, setting the wrong amount can result in an unresponsive memory hog while profiling.
This setting will also be better explained when it comes to the other Editions of Code Glass.
Application Breadcrumbs:
See Also:
Feedback
Was this page helpful?
Glad to hear it! Please tell us how we can improve.
Sorry to hear that. Please tell us how we can improve.