Allocated by Code Path Memory Statistics View
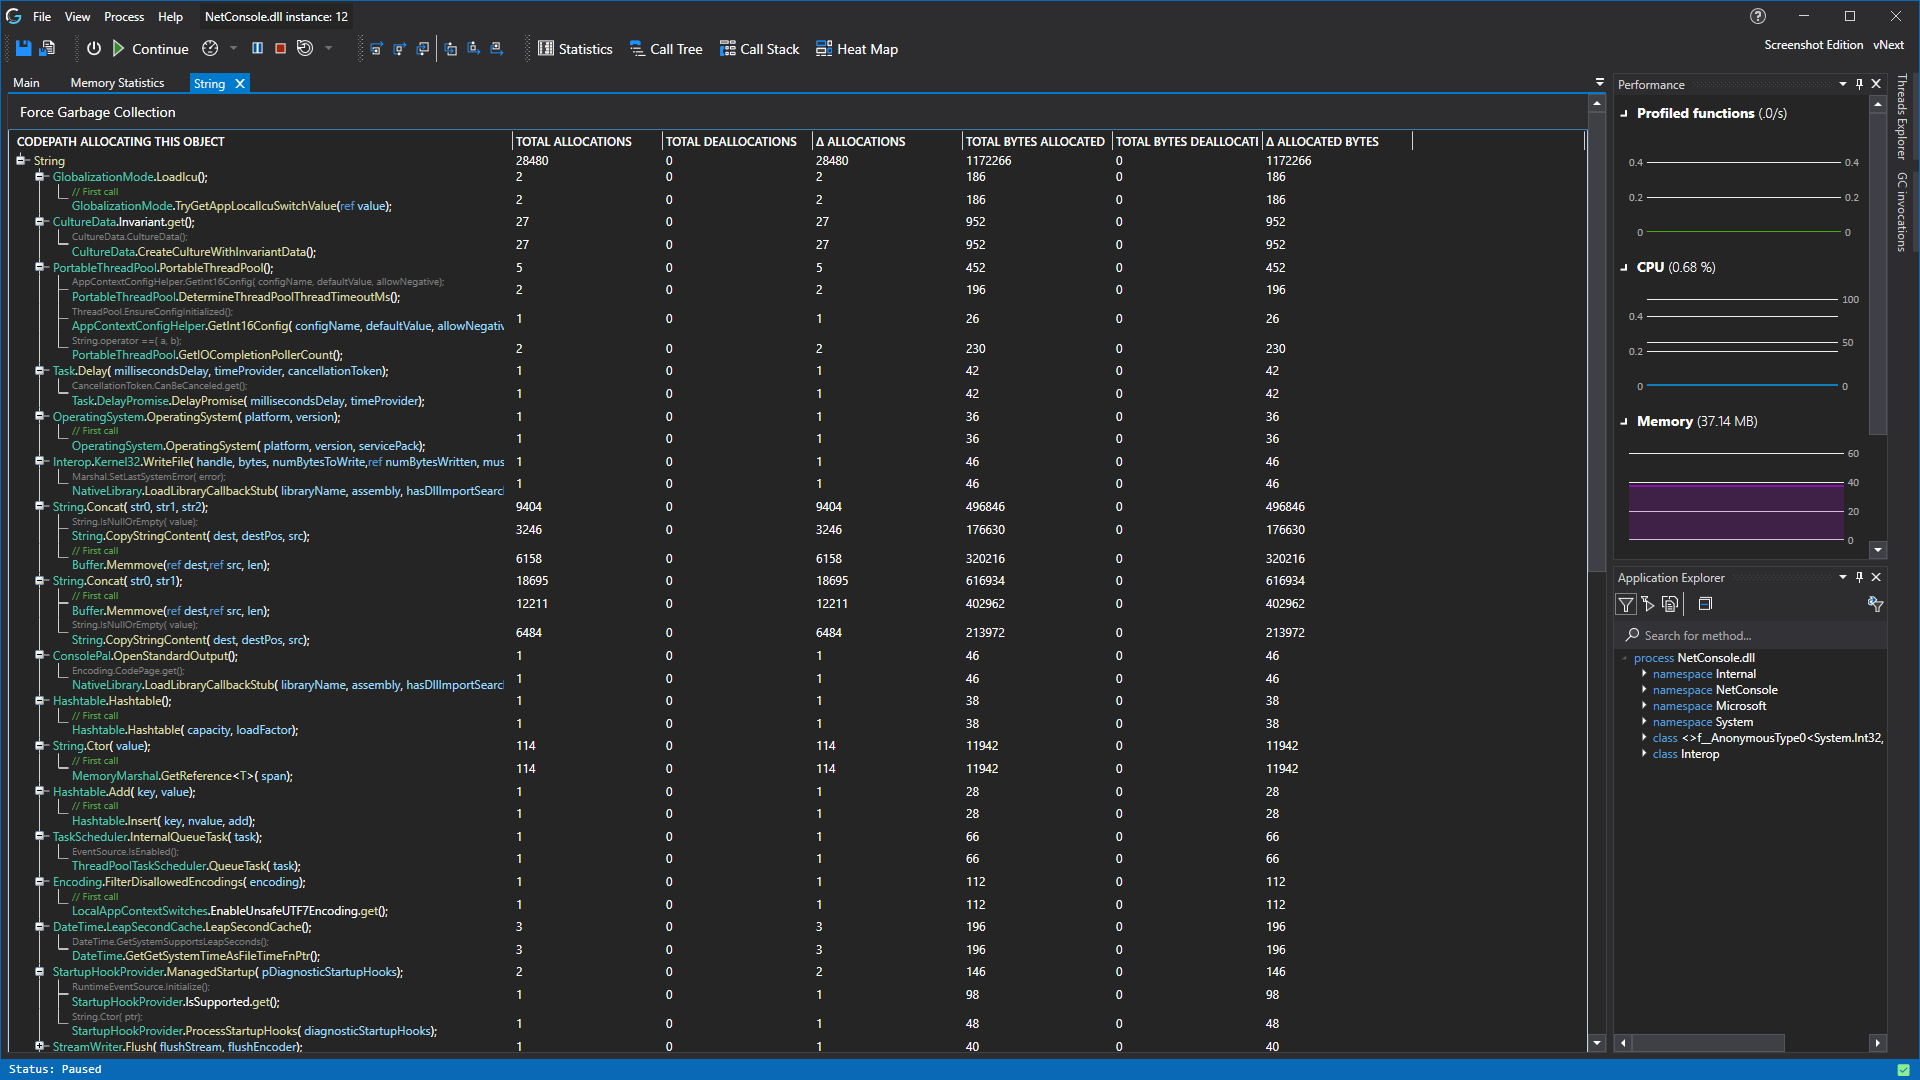
This view shows all the function that have allocated this specific object. The nested functions shows between which function calls, in the body of the parent function, the object was allocated.
Just above the statistics tree view, you find the toolbar. The toolbar contains the following items:
- Force Garbage Collection allows you to force the garbage collection to run. (This option is grayed out if the integration does not support this feature.)
When you double click on one of the tree view items it will open the code member details view.
Available Data
CodeGlass collects and displays the following pieces of memory statistics:
- Total Allocations: The amount of times an object has been allocated, or the sum of all allocated objects in that namespace.
- Total Deallocations: The amount of times an object has been deallocated, or the sum of all deallocated objects in that namespace.
- Δ Allocations: The difference between the amount of times an object has been allocated and deallocated.
- Total Bytes Allocated: The amount of bytes an object has allocated, or the sum of all allocated bytes in that namespace.
- Total Bytes Deallocated: The amount of bytes an object has deallocated, or the sum of all deallocated bytes in that namespace.
- Δ Allocated Bytes: The difference between the amount of bytes an object has allocated and deallocated.
Feedback
Was this page helpful?
Glad to hear it! Please tell us how we can improve.
Sorry to hear that. Please tell us how we can improve.